Peter Haschke
Back to the Index
Separation Plots
In the paper “The Separation Plot: A New Visual Method for Evaluating the Fit of Binary Models”, Greenhill et al. (2011) introduce a graphical method for assessing the predictive power of models with binary outcomes - separation plots. This method is implemented in the ‘separationplot’ R-package (available on CRAN).
This plot can of course be created in R without the package. See the code below:
## creating some data and estimating a logit


X <- runif(1000, 0, 1)
Y <- round(X + rnorm(1000, 0, 0.1))

mod <- glm(Y ~ X, family = binomial(logit))
Y.hat <- mod$fitted.values

## creating a sorted dataframe


Sep.Data <- data.frame(Y, Y.hat)
Sep.Data <- Sep.Data[order(Y.hat, +Y), ]

## setting plot colors (to replicate Greenhill et. al colorscheme)


col<-c(rgb(red = 254, green = 232, blue = 200, max = 255),
       rgb(red = 227, green = 74, blue = 51, max = 255))

## plotting


library(ggplot2)
library(ggthemes)

theme_set(theme_solarized())

SepPlot <- ggplot(data=Sep.Data) +
  geom_rect(aes(xmin = 0, xmax = seq(length.out = length(Y)), ymin = 0, ymax = 1),
    fill = "#FEE8C8") +
  geom_linerange(aes(color = factor(Y), ymin = 0, ymax = 1, x = seq(length.out = length(Y))),
    alpha = 0.5) +
  geom_line(aes(y = Y.hat, x = seq(length.out = length(Y))), lwd = 0.8) +
  scale_color_manual(values = col) +
  scale_y_continuous("Y-hat\n", breaks = c(0, 0.25, 0.5, 0.75, 1.0)) +
  scale_x_continuous("", breaks = NULL) +
  theme(legend.position = "none", panel.background = element_blank(), panel.grid = element_blank(),
    axis.title.y = element_text(face = "bold", angle = 90))

SepPlot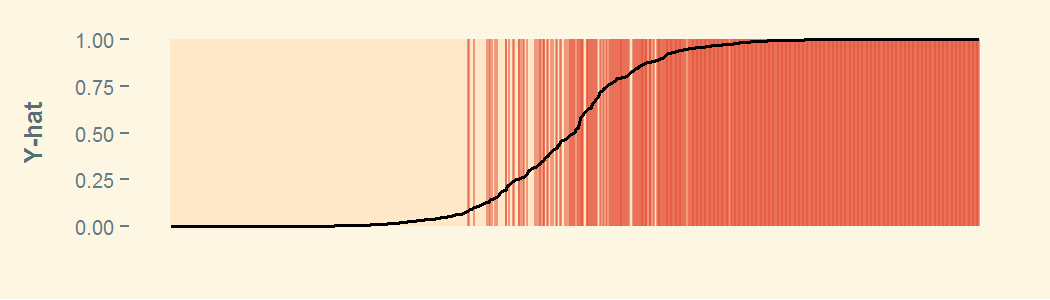
You can adjust the alpha to prevent overplotting if your data contain many 1s relative to 0s. (Setting alpha = 0.5 works well for most purposes.)
Also definitely check out the ‘ggthemes’ package (which is available on CRAN) on the odd chance you want to make the plot look like it was generated in Excel 2003. For examples look here: ggthemes package
## Solarized Dark theme


SepPlot + theme_solarized(light = FALSE) + theme(legend.position="none")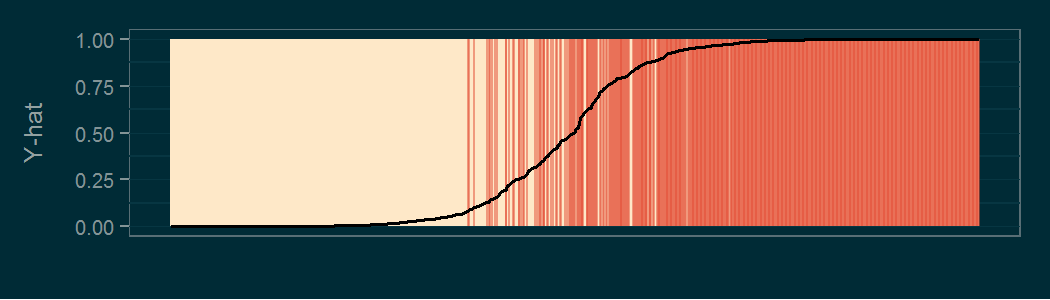
Back to the Blog-Index